System Calibration
Illumination Pattern Focus (IPF)
This plugin takes raw SIM data (1 Channel, 1 Time-point) for a bead lawn, and shows an axial side-view of the illumination pattern for the first phase of each angle. This is obtained by rotating the illumination pattern for each angle so that it is vertically-aligned, reslicing the central half of the rotated image, and performing a maximum intensity projection along the direction of the stripes. Note that there are 3 alternative methods of inputting the first angle:
degrees (IJ): measure the stripe angle for angle 1 yourself, clockwise from North.
IJ line selection: draw a line along one of the stripes from bottom to top, and the angle will be calculated.
radians (OMX): use the “Optimum k0 angle” for Direction 1, which can be found in the OMX reconstruction log file.
There is also an option to change the assumed direction of rotation from angle 1, to angle 2, to angle 3 (default is clockwise).
The separate angles are displayed stacked vertically as a montage. Ideally, the cross-section for each illumination stripe should have the appearance of a point-spread function. A “zipper”-like pattern, on the other hand, is indicative of a poorly focused illumination pattern or incorrect phase settings where the illumination pattern is created by interference of multiple beams.
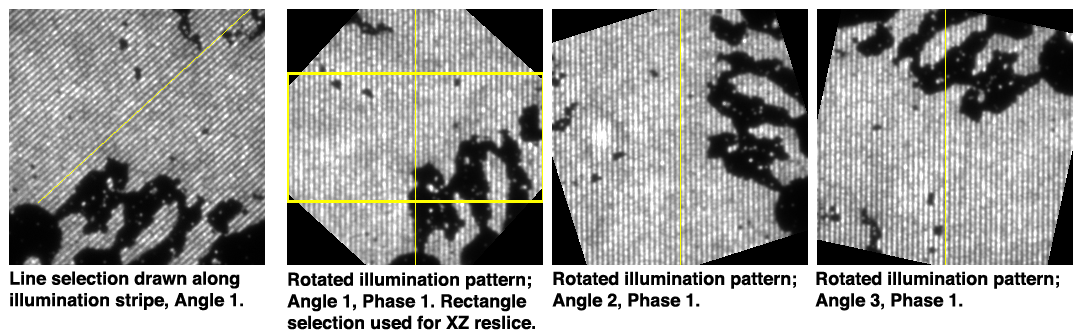
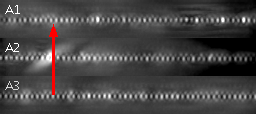
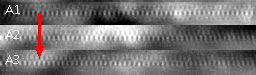
Figure 4a. Top: Sequence of steps used to produce axial views like the ones shown below. Bottom left: a well-focused illumination pattern, with each stripe showing a PSF-like appearance. Bottom right: a badly-focused illumination pattern with a zipper-like appearance.
Illumination Phase Steps (IPS)
This plugin checks system stability and alignment by detecting illumination pattern frequencies in raw SIM data and plotting the phase steps (taken from 1st order frequency). The SIM illumination pattern should be in-focus and the sample should fill most of the field of view: a bead lawn or fluorescent ink slide works well. In addition to plotting the phase steps for visual inspection, a number of statistics are also reported. The main stats are the standard deviations of the illumination pattern frequency, the phase step size, and reproducibility of the offset (i.e. whether the phase returns to the same position after each cycle or not). In addition, estimated illumination pattern line-spacing and k0 angles are reported.
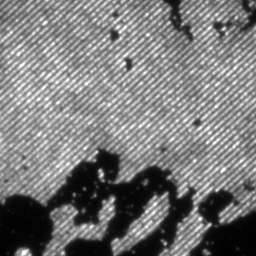
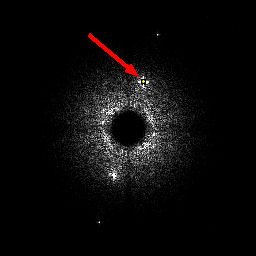
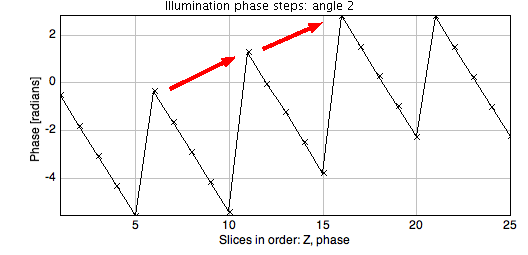
Figure 4b. From left to right: a bead lawn sample image; filtered Fourier transform for the Angle 2 central slice, with 1st order illumination pattern frequency peak marked; plot of the phase steps with red arrows highlighting phase offset drift (phase step standard deviation between sequential points on the plot was 0.03 radians, or 2%).